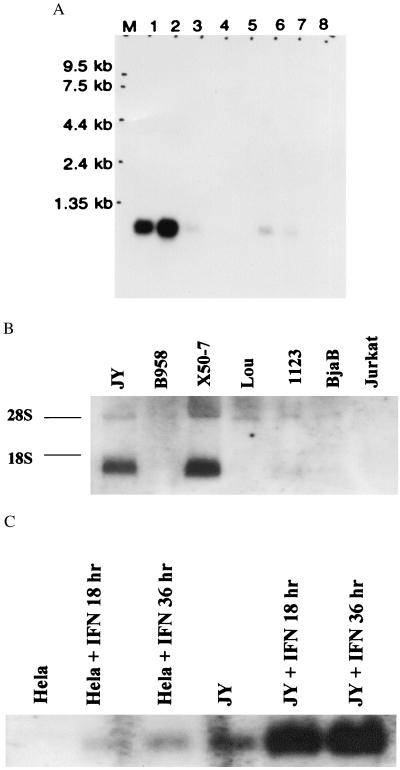
Figure 2.
Northern blot analysis of FAT10 mRNA. (A) The multiple human normal tissues Northern blot (CLONTECH). Lane 1, spleen; 2, thymus; 3, prostate; 4, testis; 5, ovary; 6, small intestine; 7, colon mucosas lining, and 8, peripheral blood leukocytes. Lane M is the RNA marker as labeled. (B) The analysis of total RNA blots from various cell lines. The RNA preparation and hybridization were performed as described (29). The origins of cell lines are indicated at the top and the two ribosomal RNA bands are indicated at the side as 28S and 18S. (C) γ-IFN treatment (3,000 u/ml) (0, 18, and 36 hr) induces progressive increases in FAT10 mRNA expression in JY and HeLa cells.

