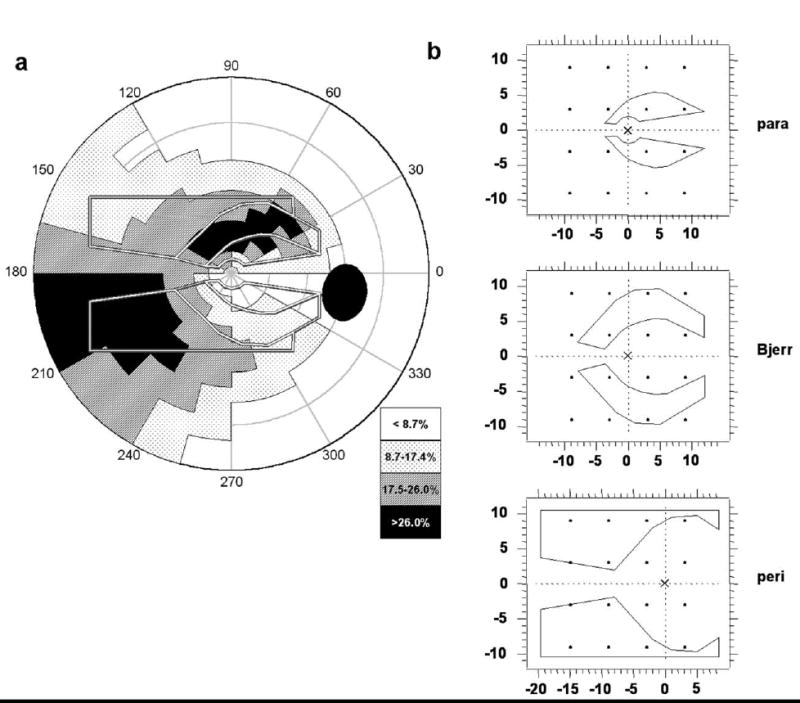
Fig. 1.

(a) Frequency distribution of focal retinal regions of glaucomatous damage (adapted from Aulhorn and Karmeyer, 1976). Gray/white lines are the outlines of the three stimulus pairs used in the present study: paracentral, Bjerrum, and peripheral. Key to shading scale indicates percent of instances of loss in an area. (b) Stimulus layout on the display monitor. All stimuli are for a right eye; the fixation point is indicated by an “X”. The dots represent the test grid for threshold perimetry (6º offset grid); dot size is Goldman size III stimulus size to scale.
