
Fig. 4.
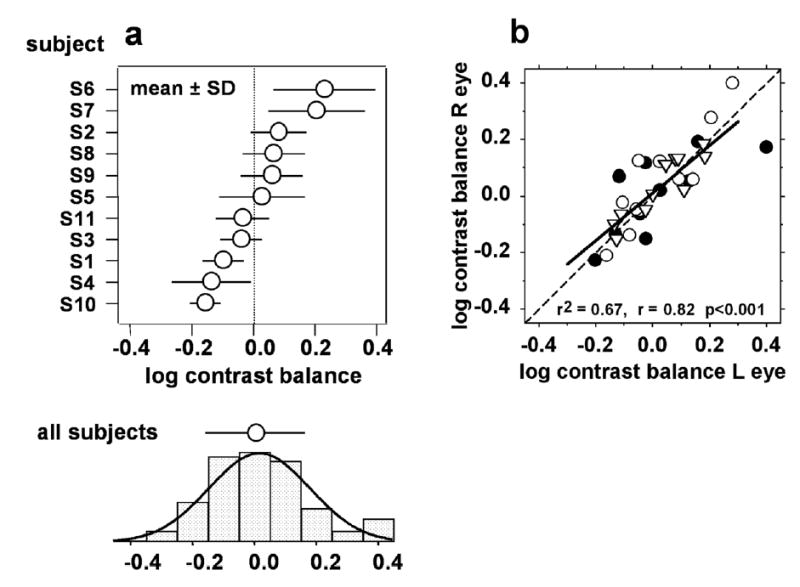
Contrast balance distributions for the subject group. (a). Contrast balance distributions for all individual trials from each subject, grouped by subject (mean ± SD). There were generally 24 trials for each subject, so most SEM error bars would not be larger than the symbol size. The distribution and mean ± SD shown at the bottom are for pooled data from all subjects. The smooth curve is the best-fit normal distribution for the pooled data: the data are not significantly different from a normal distribution according to a K-S test (d=0.07, p>0.05). With a S-W test, the distribution deviates from normal (W=0.97, p<0.05), due to the small cluster of points at the positive end of the distribution. (b). Comparison of the two eyes in each subject. The mean ± SD for each stimulus in each subject’s right eye is plotted against the mean ± SD for the left eye. Filled circles: paracentral stimulus; open circles: Bjerrum stimulus; inverted triangles: peripheral stimulus.