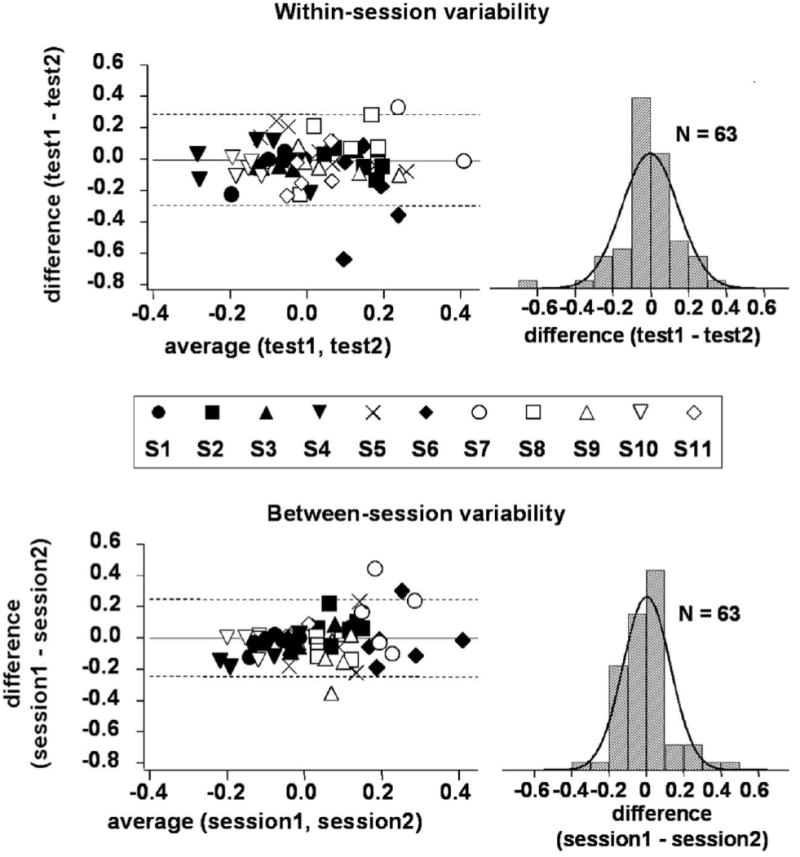
Fig. 5.

Within-session and between-session variability in the log Contrast balance. For within-session variability, the difference used is (test 1 - test 2) from a single session; for between-session variability, the difference used is (session 1 average - session 2 average). At left are scatter plots of difference vs. average (Bland and Altman, 2003). Dashed lines indicate the 95%CI. At right are the distributions of the differences; neither distribution differed significantly from normal according to Kolmogorov-Smirnov and Shapiro-Wilk tests.
