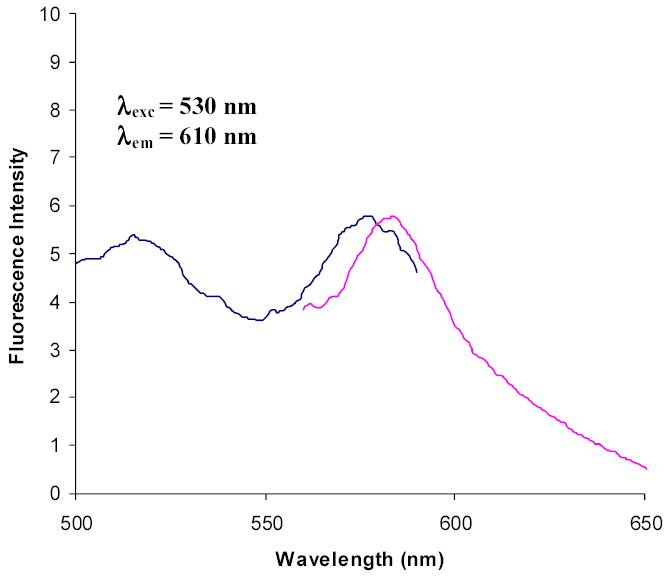
Figure 5.

Normalized excitation and emission fluorescence spectra of cytoplasmic MBP-R-PE alpha subunit fusion protein after attachment of PEB in vivo. Emission wavelength used to record excitation spectrum was 610 nm. Excitation wavelength used to record emission spectrum was 530 nm. Spectra show excitation peak at 577.5 nm and emission peaks at 584.0 nm, and indicate formation of fluorescent fusions containing PEB. Fusion protein between cytoplasmic MBP and R-PE beta subunit showed the same fluorescence spectra after PEB attachment. Excitation peak at 517 nm comes from the solvent (maltose elution buffer).
