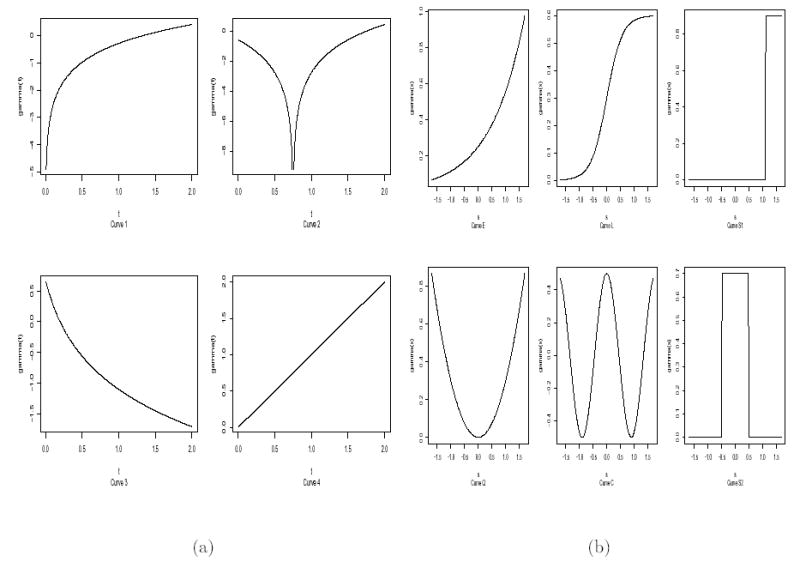
Figure 2.

(a) Curves used in the simulation evaluating power of the tests for proportional hazards. Curve 1: γ(t) = log{.75t}; curve 2: γ(t) = log{2/(1 + 5t)}; curve 3: γ(t) = log{et} = t; curve 4: γ(t) = log{(t – .75)2}; curve 5: γ(t) = log{eI(t≥1)} = I(t ≥1). (b) Curves used in the simulation evaluating powers of the tests for covariate effects. Curve E: γ(s) = .25 exp{.8s}; curve L: γ(s) = .6 exp{3.5s}/(1 + exp{3.5s}); curve S1: γ(s) = .9I(s > 1.1); curve Q: γ(s) = .3s2; curve C: γ(s) = .5 cos(3.5s); curve S2: γ(s) = .7I(|s| < .5).
