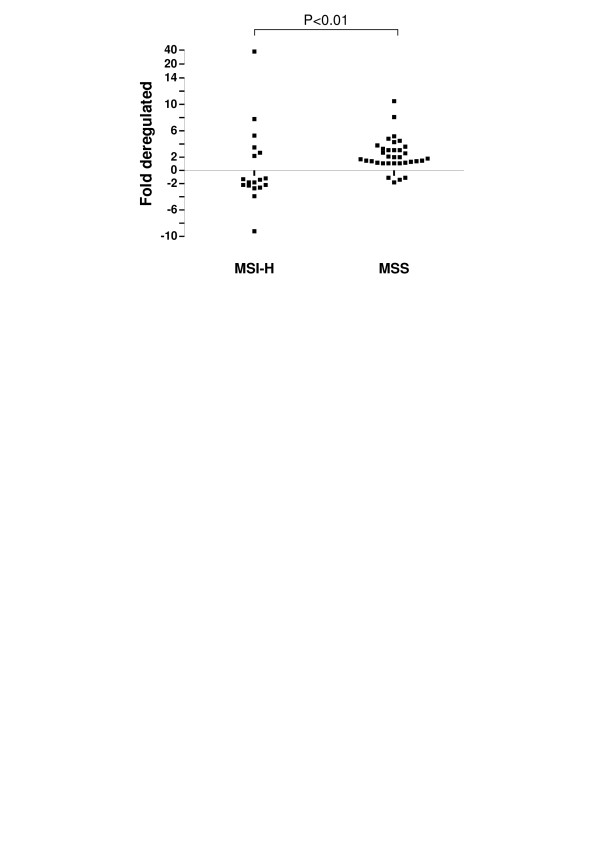
Figure 1.

Distribution of SnoN expression in tumours stratified by MSI-status. SnoN data points were determined by semi-quantitative real-time PCR and are expressed as either fold up- or down-regulated, as compared to matched normal mucosa. Whilst there was a wide range of increased and decreased expression changes in the MSI-H subgroup, no MSS tumours demonstrated down-regulation greater than 2 fold.
