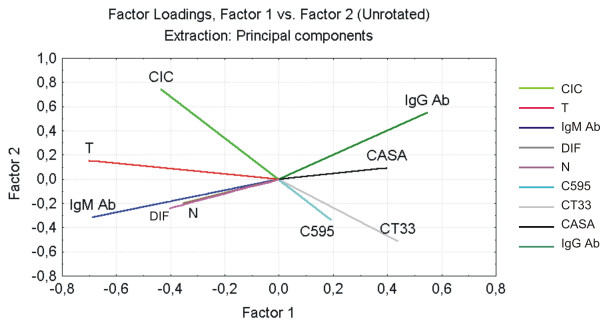
Figure 2.

Multivariate Principal Component Analysis of clinical and histopathological data and tissue and serum expression of MUC1. Each variable is represented by vectors, which longitude correspond to the weight of the variable in the model, and their projection to both axes corresponds to the weight of the two main factors extracted (Factor 1 and Factor 2). These two factors explain 39% of the variations observedin the model. This percentage is remarkable taking into account that variables belong to patients. CIC = Circulating immune complexes levels; T = Tumor stage; N = Node status; DIF = tumor differentiation; CASA = Serum MUC1 levels; IgM Ab = free anti-MUC1 IgM antibodies; IgG Ab = free anti-MUC1 IgG antibodies; C595 = MUC1 extracellular domain expression; CT33 = MUC1 Cytoplasmic tail expression.
