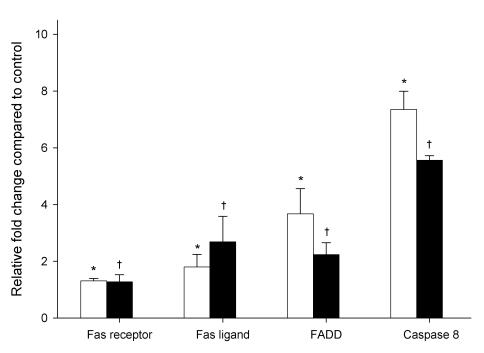
Figure 3.
mRNA expression levels of members of the Fas signaling cascade in HepG2 cells exposed to 1mM ethanol concentration expressed as a relative fold change compared to control HepG2 cells (not exposed to ethanol). White and black bars represent 6 and 24 hr exposure times, respectively. Results are the mean of six different experiments (n=6). Error bars represents standard deviations. Significance is shown as the difference between ethanol-treated and control cells at 6 h (* p < 0.05) and 24 h († p < 0.05).

