Figure 2.
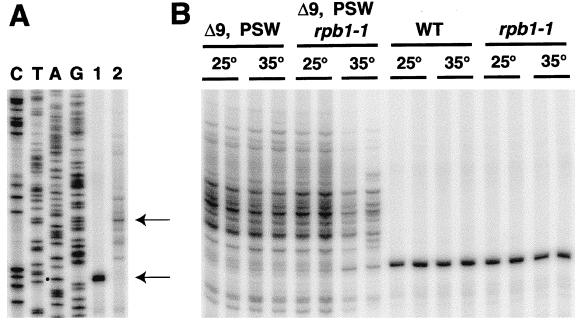
Identification of 5′ ends of primary rRNA transcripts and evidence for transcription by Pol II in PSW strains. (A) RNA samples from control strain NOY505 (lane 1) and PSW strain NOY794 (lane 2) were analyzed by primer extension using a 32P-labeled primer. The sequence ladder was obtained by dideoxy sequencing using the same primer and pNOY3237 DNA as template. Major start sites are indicated by ←. A dot marks the band in lane A corresponding to the published Pol I start site. (B) RNA samples were prepared from NOY878 (Δ9, PSW), NOY900 (Δ9, PSW, rpb1–1), NOY556 (WT), and NOY898 (rpb1–1) with and without temperature shift from 25° to 35° as indicated. Primer extension was carried out in duplicate as in A. Quantification of the sum of all Pol II-specific bands from −9 to −95 was done for NOY878 and NOY900 and that of the Pol I-specific band at +1 was done for NOY556 and NOY898 by using PhosphorImager analysis. A significant decrease (≈3-fold) of rRNA synthesis after temperature shift-up was observed for NOY900 but not for the other strains (see below). Gels shown are those visualized by a PhosphorImager. Four to seven reverse transcription analyses similar to that shown in the figure were done by using two independent RNA preparations for each strain. The values obtained for the ratio of rRNA synthesis at 35°C to that at 25°C are: NOY900, 0.33 ± 0.07; NOY878, 1.01 ± 0.29; NOY898, 0.80 ± 0.09; and NOY556, 0.83 ± 0.19.

