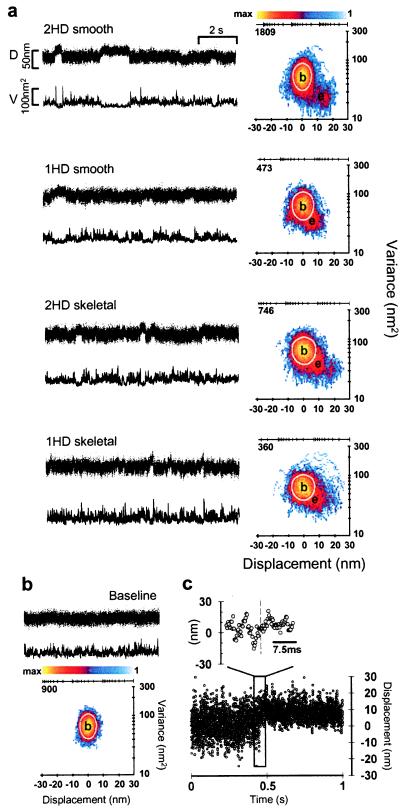
Figure 2.
Representative displacement data for single-headed (1HD) and double-headed (2HD) smooth- and skeletal-muscle myosins. (a) Raw time series (Left) and MV histograms (Right) representing 2HD and 1HD smooth- and skeletal-muscle myosin records. Beneath each position record (D) is the running variance (V) calculated for that segment of data by using a 20-ms window. MV histograms in a were calculated with a 20-ms window by transforming the entire record (≈30–60 s in length) from which representative traces were taken (see Methods). Note that the event populations (e) shown in 1HD histograms are roughly half the distance from baseline (b) when compared with 2HD MV transform. (b) Representative baseline record with accompanying MV histogram. Note the lack of an event population in the baseline transform. The color bars in a and b represent the palette used to color code the number of counts (i.e., points with a given mean and variance) in a given bin. In this representation, bins with zero counts are colored white (background). The axes above each histogram in a and b represent the log-scaled distribution of the color bar and are accompanied by the maximum number of counts in each case. The white boundary on each histogram represents the 95% confidence limit of the fit to the baseline population. (c) The expanded view shows the rapid rise of a displacement step (complete in ≤2 ms).

