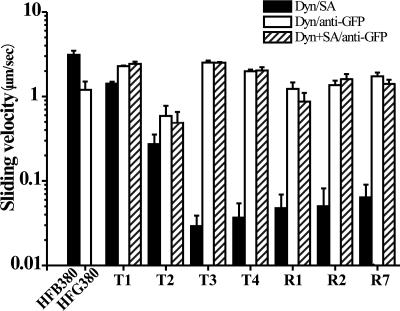
Fig. 2.
MT-sliding velocities are plotted as log-scale histograms. When the dynein (Dyn) constructs were anchored on a glass surface via their biotin moiety, the MT sliding velocity dramatically depends on anchoring position (filled bars, Dyn/SA, with SA being streptavidin). In contrast, when the dyneins were anchored on the glass via the N-terminal GFP moiety, they drove robust MT sliding at a similar velocity, independent of the biotin tag position (open bars, Dyn/anti-GFP), which was not affected by saturating the biotin moiety with streptavidin before measurement (cross-hatched bars, Dyn+SA/anti-GFP). Error bars indicate SD.

