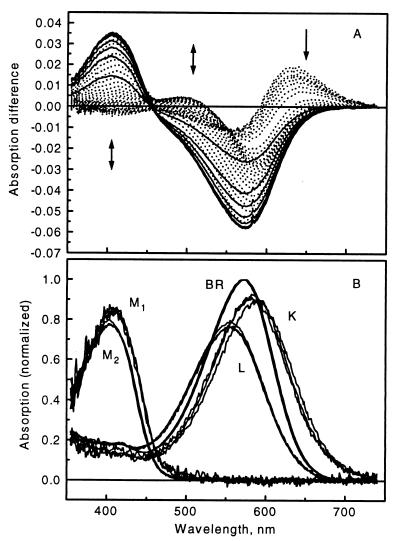
Figure 1.
(A) Time-resolved difference spectra measured in the 70-ns to 420-ms time domain on D96N mutant BR at pH 8, 5°C. The arrows indicate the time evolution of the signal, and the solid curves correspond to the final decay phase. The spectra are reconstructed from the first 4 SVD components. (B) Intermediate absorption spectra of D96N BR calculated for 5, 15, and 25°C at pH 8.

