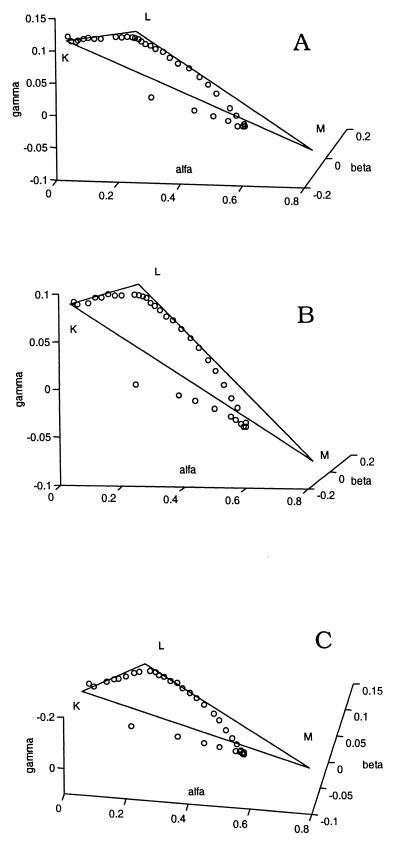
Figure 2.
Three-dimensional plots of the combination coefficients for D96N BR at 5°C (A), 15°C (B), and 25°C (C), pH 8, in the rank-3 approximation of the entire data matrix. Open circles, combination coefficients for the measured difference spectra. The stoichiometric plane is represented as the K, L, M1 triangle.

