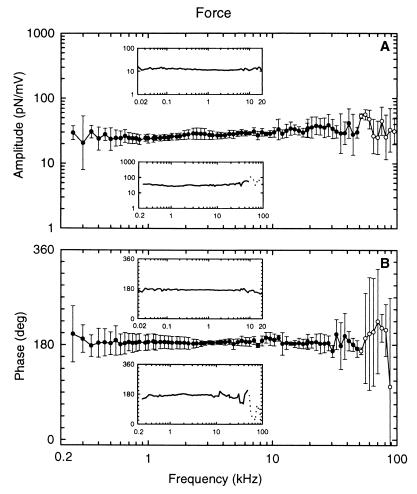
Figure 4.
Amplitude (A) and phase (B) of the electromechanical force generated by the OHC as a function of stimulus frequency, measured under loaded conditions (Fig. 1B). Data for three OHCs (qL = 68, 38, 28 μm), stimulated with frequencies between 250 Hz and 100 kHz, were averaged. (Lower Inset) Data for one of the averaged cells. The standard deviation of the measurement values is given by the vertical error bars. (Upper Inset) Representative example of an OHC where the electromechanical force was measured between 20 Hz and 20 kHz (qL = 15 μm). Amplitudes and phases are independent of frequency up to at least 50 kHz. Unavoidable resonances in the mechanical support for the AFL are responsible for the peaks and dips in the responses above 50 kHz (open circles), as well as the phase lag of 20° between 13 kHz and 32 kHz. The compliance of the AFL was 6 m/N.

