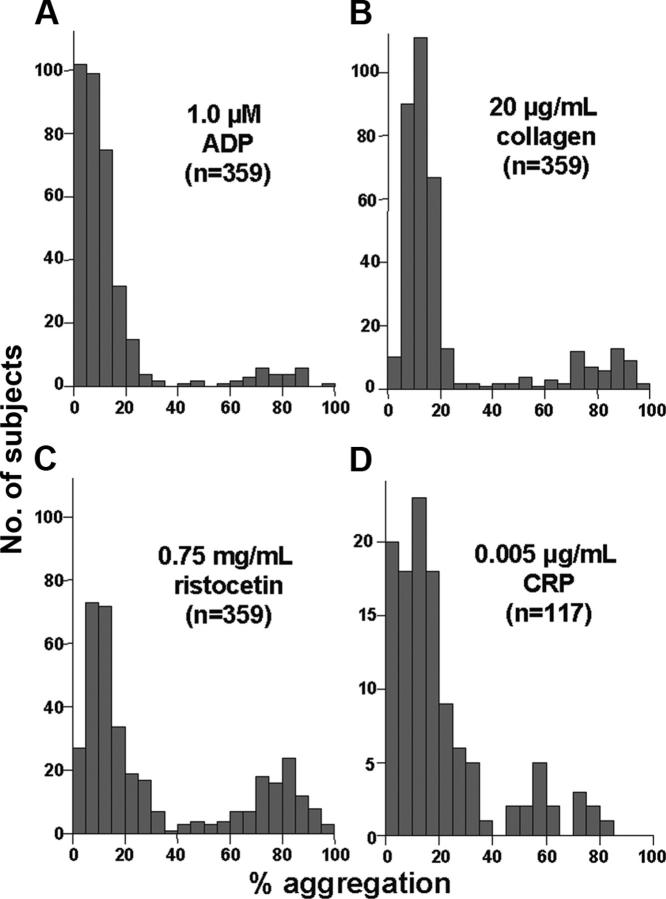
Figure 2.
Distribution of aggregation response to submaximal agonist concentrations. These histograms depict the number of subjects (y-axis) with a given level of platelet aggregation (x-axis) to the indicated agonists. Seven percent, 15%, and 26% of subjects exhibited more than 60% aggregation in response to 1 μM ADP (A), 20 μg/mL collagen (B), and 0.75 mg/mL ristocetin (C), respectively. The histogram for 0.005 μg/mL CRP (D) differed slightly, with a small peak of responses just below 60% (13% of subjects showed > 50% aggregation), perhaps due to a smaller number of subjects.

