
Figure 5.
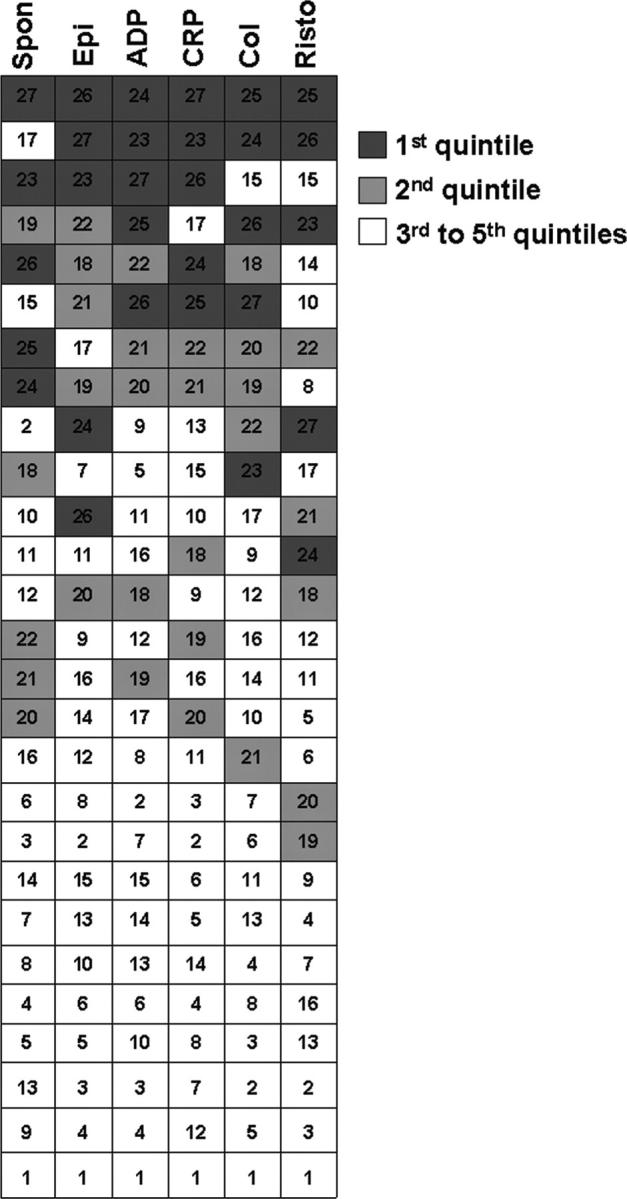
Correlation of extent of platelet reactivity among different agonists. Each of the 27 rows of boxes represents one subject in the reproducibility study. Data from each of 4 runs of each assay were averaged for spontaneous aggregation (Spon) and aggregation to 0.4 μM epinephrine (Epi), 1.0 μM ADP, 0.005 μg/mL CRP, 20 μg/mL collagen (Col), and 0.75 mg/mL ristocetin (Risto). For each assay, subjects were ranked according to average aggregation (1 = lowest, 27 = highest). Boxes are shaded according to ranking by quintiles for each assay (eg, subjects who were ranked 23-27 fell into the top quintile and are marked in dark gray). The number in each box of a given row represents the rank for that subject on a specific assay.