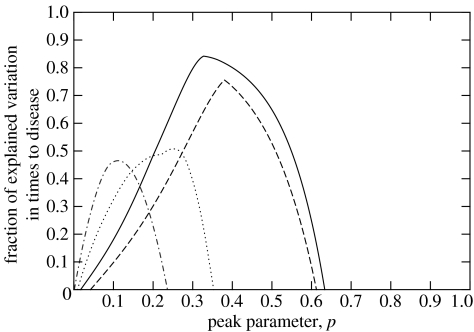
Figure 1.
Distribution of the peak parameter, p, illustrating the goodness-of-fit, measured by the fraction of explained variation in times to disease for four of the five HCMV diseases under consideration (fever—solid line; pneumonitis—dotted line, gastrointestinal disease—dashed line and hepatitis—dashed-dotted line). All fitted peak parameters are between 0 and 1. The fraction of explained variation in time to disease is significant for all diseases, except for hepatitis (n=4) (see table 1).

