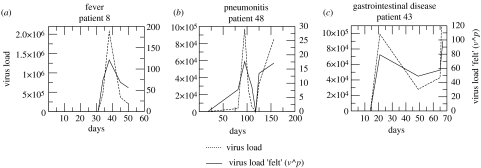
Figure 3.
Comparison of representative longitudinal HCMV load profiles measured in the blood of patients with fever, gastrointestinal disease and pneumonitis with the effective viral load ‘felt’ by the host (viral load scaled by the peak parameter, p). Dashed line, viral load; solid line, virus load ‘felt’ (v^p).

