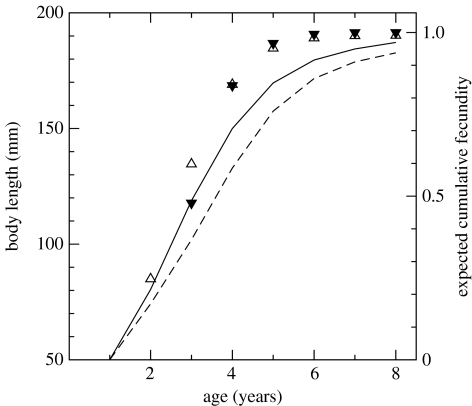
Figure 2.
Growth curves (lines) and expected cumulative fecundity (symbols) of ‘late’ and ‘early’ ESS phenotypes when the ‘late’ one dominates the population. Solid curve and black triangles represent the ‘late’ phenotype; dashed curve and open triangles correspond to the ‘early’ one. The pattern is nearly identical when the ‘early’ phenotype dominates.

