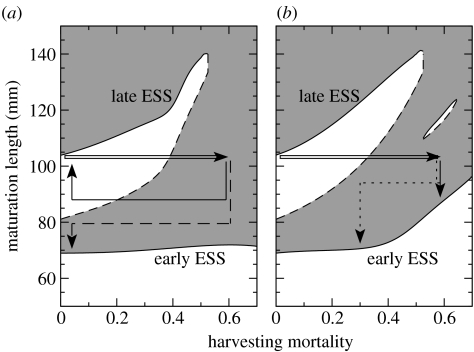
Figure 3.
Effect of harvesting intensity and size threshold on alternative evolutionary stable maturation sizes for equilibrium populations (based on adaptive dynamics approach). Harvesting size threshold equal to (a) 100 mm and (b) 80 mm. White and grey regions indicate harvesting intensities with evolution to larger and smaller maturation sizes, respectively. Solid and dashed lines: evolutionary stable states and evolutionary saddle points (repellors), respectively. Open arrows: initial increase in harvesting intensity (in year 0 in figure 1). Solid and dashed arrows in (a): consequences of imposing complete fisheries moratoria after 25 and 50 years, respectively. Solid and dotted arrows in (b): consequences of continued harvesting versus partial moratorium imposed 40 years after the onset of harvesting (see figure 1 for corresponding dynamics). Solid arrows indicate trajectories with reversible evolutionary response, while dashed and dotted arrows indicate trajectories with evolutionary regime shift.

