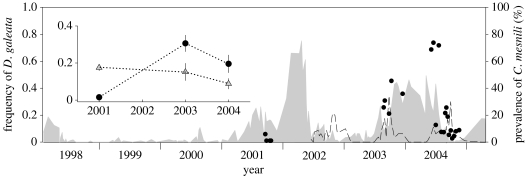
Figure 1.
Changes in the frequencies of D. galeata (grey area) in the Daphnia population of Greifensee from January 1998 to May 2005. The black dots show the frequencies of D. galeata in infected subsamples during the 2001, 2003 and 2004 epidemics. The prevalence of C. mesnili in the entire Daphnia population (data available since June 2002) is indicated with a dashed line. In the sub-figure, the annual mean frequencies (± s.e.) of D. galeata in infected (black dots) and non-infected (grey triangles) subsamples are shown. The significant interaction is visible. Data before July 2002 have been published in different form by Keller & Spaak (2004) and Wolinska et al. (2004).

