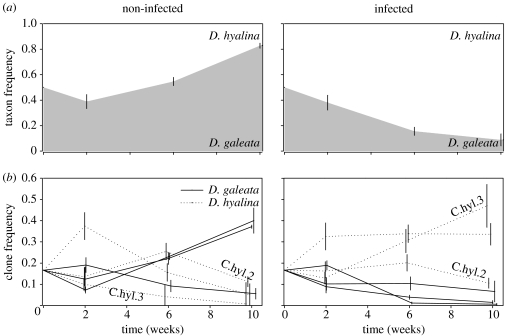
Figure 2.
Changes in (a) taxa and (b) clone frequencies in the non-infected (left) and infected (right) treatment of the competition experiment. Mean taxon/clone frequencies (±s.e.) are shown (grey area and solid lines, D. galeata; white area and dotted lines, D. hyalina). Clonal identities are given for those clones with relative frequencies (within-taxon) that differed significantly between treatments (see table 1).

