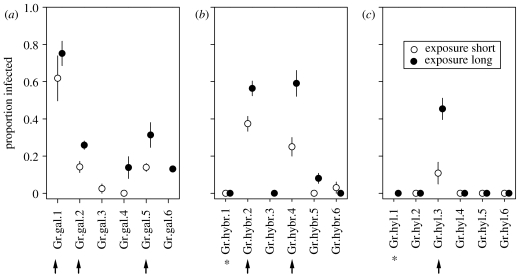
Figure 3.
Proportion (±s.e.) of infected individuals, (a) D. galeata, (b) hybrids and (c) D. hyalina, in the infection experiment, in relation to taxon, clone and exposure time to parasite spores. Parasites from the 2003 epidemic were used for this experiment. Clones that had carried an infection at the time of their isolation in 2002 are labelled with asterisks. The arrows indicate clones which were tested for a variation in their fitness reduction (see text).

