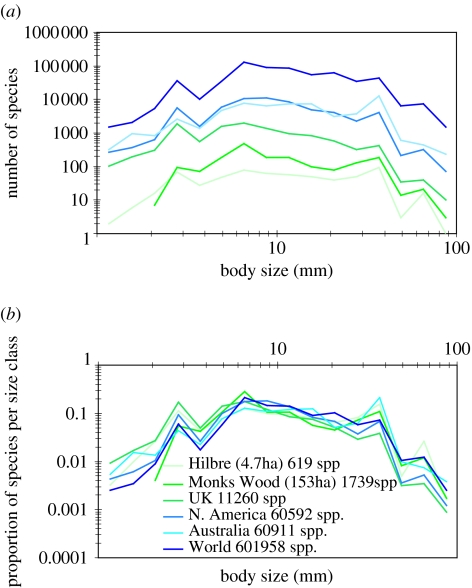
Figure 2.
(a) Size–frequency distributions (SFDs) of insects at six spatial scales, where the insect ‘body length’ axis is divided into 16 logarithmic (base 10) size classes and yields at least four regions of coincident peaks at all spatial scales. Note that North America and Australia are similar in both geographical area and species richness (America: 60 592 spp.; Australia: 60 911 spp.). (b) When the SFD data are expressed on a proportionate basis, the six curves lose their individual identities and become superimposed upon each other.

