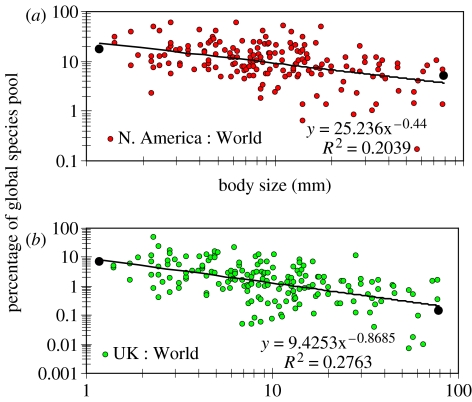
Figure 3.
With decreasing mean body size, local species richness (e.g. UK or North America) represents an increasing fraction of global species richness. Each symbol represents one insect family. The black symbols represent the example data for Papilionidae and Thripidae referred to in the text. (a) North America : World, y=25.24x−0.44; R2=0.204. (b) UK : World, y=9.425x−0.869; R2=0.276.

