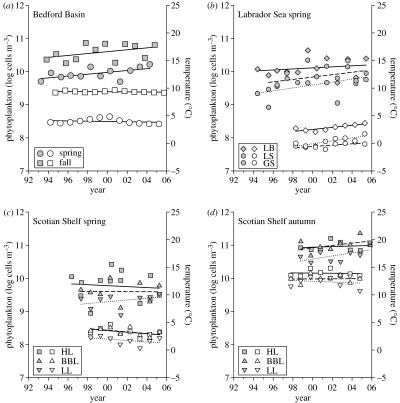
Figure 5.
Multiyear seasonal trends in temperature (open symbols) and phytoplankton abundance (filled symbols). (a) Bedford Basin. Spring (circles), fall (squares). (b) Labrador Sea in spring. Symbol coded as in figure 1c. (c) Scotian Shelf in spring. Symbols coded as in figure 1a. (d) Scotian Shelf in autumn. Symbols coded as in figure 1a. All lines are ordinary least squares regression.

