Figure 6.
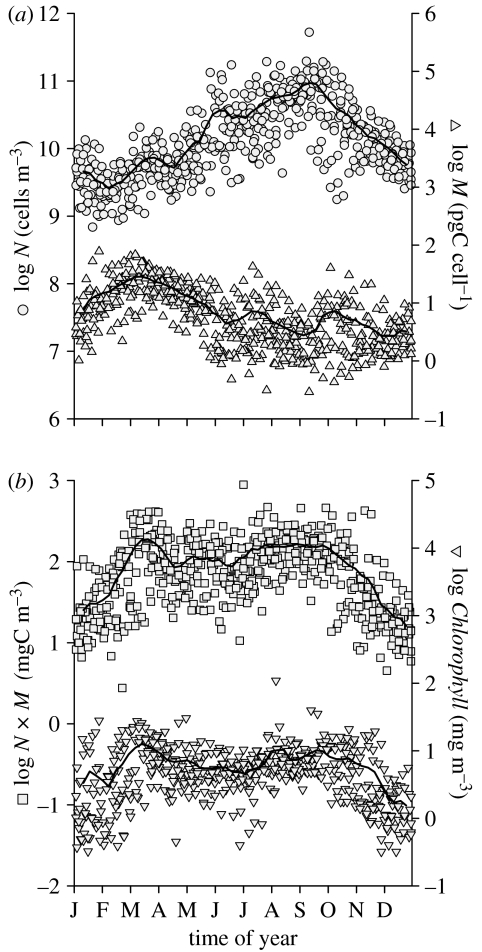
Multiyear annual cycle in Bedford Basin. (a) Phytoplankton abundance, N (circles, left ordinate); average cell mass, M (triangles, right ordinate). (b) Phytoplankton biomass, N×M (squares, left ordinate); particulate chlorophyll concentration, Chl (inverted triangles, right ordinate). Solid lines are three-point running means of data binned by week number and averaged over all years of observation.

