Table 1.
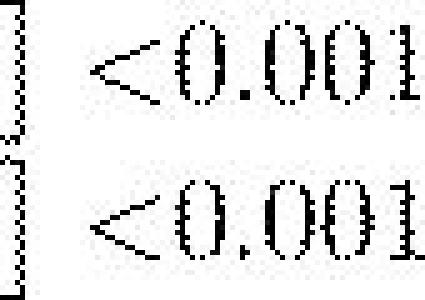
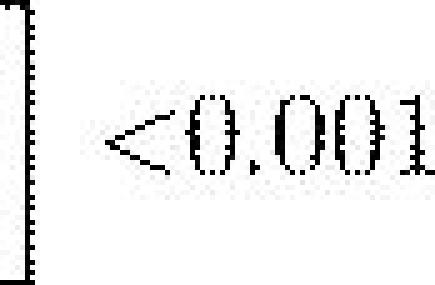
Fitness average of the last 10 generations () for the three genetic architectures in unrelated (r=0) and highly related (r=1) colonies with different reallocation probabilities Pr.
| r=0 | r=1 | |||||
|---|---|---|---|---|---|---|
| p-values | p-values | |||||
| dyn, Pr=0.00 | 95.97 |  |
 |
99.87 |  |
 |
| det, Pr=0.00 | 98.14 | 21.97 | ||||
| prob, Pr=0.00 | 94.51 | 98.68 | ||||
| dyn, Pr=0.10 | 94.20 |  |
 |
99.88 |  |
 |
| det, Pr=0.10 | 86.11 | 21.95 | ||||
| prob, Pr=0.10 | 82.32 | 87.60 | ||||
| dyn, Pr=0.20 | 94.46 |  |
 |
99.91 |  |
 |
| det, Pr=0.20 | 84.50 | 21.96 | ||||
| prob, Pr=0.20 | 78.02 | 85.57 | ||||
| dyn, Pr=0.30 | 94.85 |  |
 |
99.87 |  |
 |
| det, Pr=0.30 | 83.83 | 21.93 | ||||
| prob, Pr=0.30 | 75.22 | 84.70 | ||||
| dyn, Pr=0.40 | 95.16 |  |
 |
99.89 |  |
 |
| det, Pr=0.40 | 83.55 | 21.95 | ||||
| prob, Pr=0.40 | 73.45 | 84.34 | ||||
