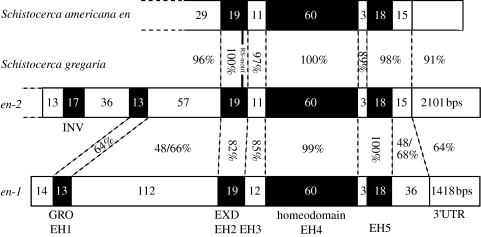
Figure 3.
Bars represent Schistocerca engrailed-family genes/proteins. The number of amino acids each region encodes is shown within the bars. The location of the RS-motif in S. americana engrailed & Schistocerca gregaria engrailed-2 is indicated by a vertical bar. The percentages between the bars indicate levels of nucleotide identity. The microexon encoding the RS-motif was not included in comparisons. The region between EH1 and EH2, the region C-terminal to EH5 and the 3′UTR are difficult, if not impossible, to align between Sgen-1 and Sgen-2. The percentage identity values shown are arbitrary. Varying gap penalties results in distinct alignments and different percentage identity values. The values here derive from alignments constructed using minimum gap penalties and so maximize levels of sequence identity. For the region between EH1 and EH2 and the region C-terminal to EH5, two percentage identity values are shown, derived from alignments using amino acid and nucleotide sequence, respectively. EXD, extradenticle-binding domain; GRO, groucho-binding domain; INV, invected-specific domain.

