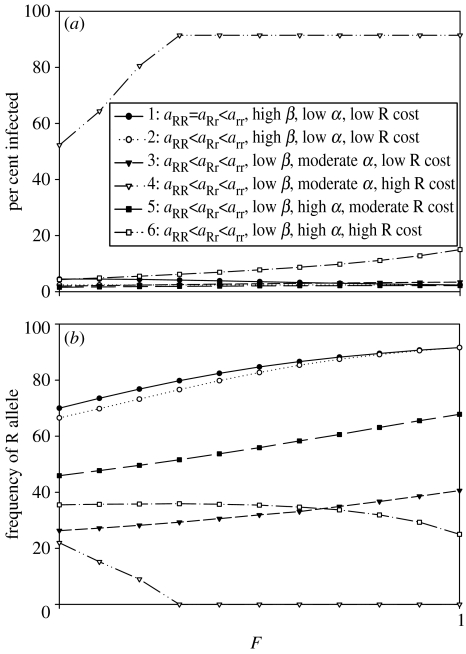
Figure 3.
(a) Summary of percentages infected in the population at equilibrium as a function of F. (b) Summary of the frequency of R alleles in the population at equilibrium as a function of F. Parameters: ‘curve 1’ as in figure 1a; ‘curve 2’ as in figure 1b; ‘curve 3’ as in figure 2; ‘curve 4, high cost of R’ as in curve 2, but with aRR=0.4 and aRr=0.6 (see figure E1 in electronic supplementary material); ‘curve 5, high α, moderately high cost of R’ as in curve 2, but with α=1.0, aRR =0.6 and aRr=0.7 (see figure E2 in electronic supplementary material); ‘curve 6, high α, high cost of R’ as in curve 4, but with α=1.0 (see figure E3 in electronic supplementary material).

