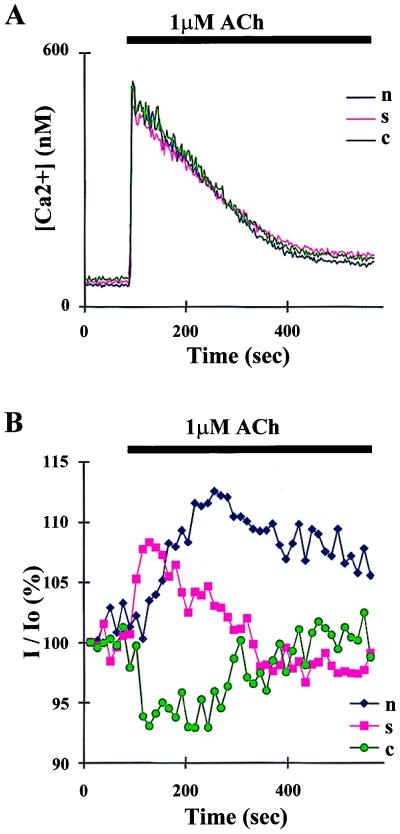
Figure 3.
A rapid, global [Ca2+]i rise triggers CaM redistribution. The ACh stimulation periods are indicated by the bars. (A) Typical [Ca2+]i signal in response to 1 μM ACh (measured by using Fura-2) in three regions of interest: nucleus (blue trace), SG region (red), and basal nonnuclear area (green). (B) ACh-evoked changes of DTAF-CaM fluorescence in the nucleus (blue), SG region (red), and basal nonnuclear area (green). A and B were recorded in separate experiments.

