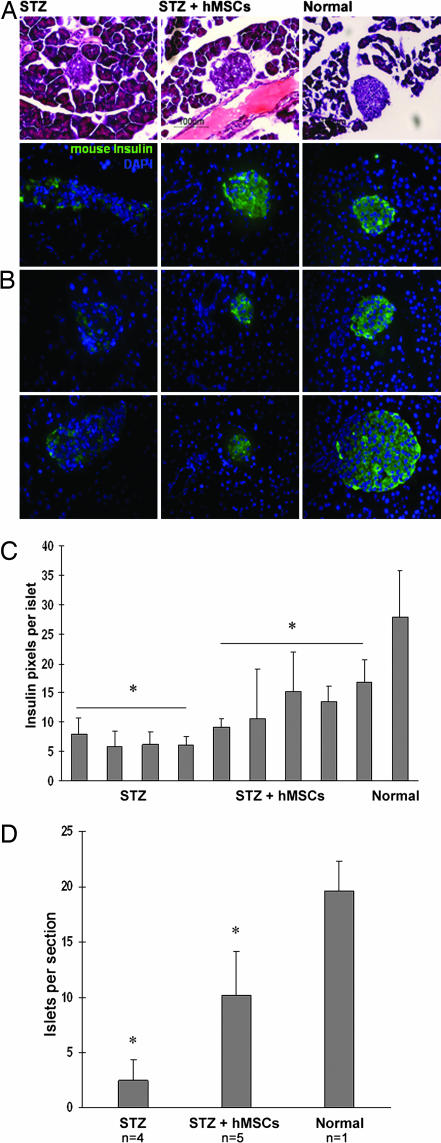
Fig. 2.
Histology of pancreas from diabetic mice (STZ-treated), hMSC-treated diabetic mice (STZ + hMSCs), and control mice (Normal) at day 32. (A) Morphology of islets stained with hematoxylin and eosin. Sections (5-μm) are magnified ×400. (B) Islets labeled antibodies for mouse insulin. Nuclei labeled with DAPI. Sections (5-μm) are magnified ×400. (C) Insulin pixels per islet. Values are mean ± SD. ∗, Values that differ from each other with P = 0.0079. (D) Islets per section. Values are mean ± SD. ∗, Values that differ from each other with P = 0.002. n = 4 or 5.

