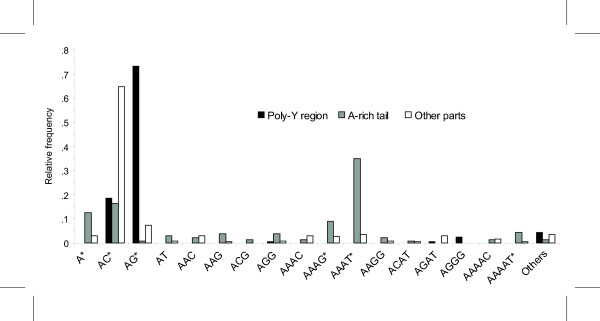
Figure 2.

Relative abundance of repeat motifs within tRNA SINE regions. Relative abundance of repeat motifs within tRNA SINE regions: poly-Y (N = 161), A-rich tail (N = 134), and other parts (N = 227). Differences in specific motif abundance were tested using Fisher's exact tests comparing specific region/motif with the combined values of the other two regions. Repeat motif with frequencies which have a significant departure compared to Bonferroni-corrected alpha for 18 comparisons (P-value < .0028) are indicated with an asterisk (*). Thirty-five MSs were excluded because they were associated with SINEs which did not have a typical structure.
