
Figure 1.
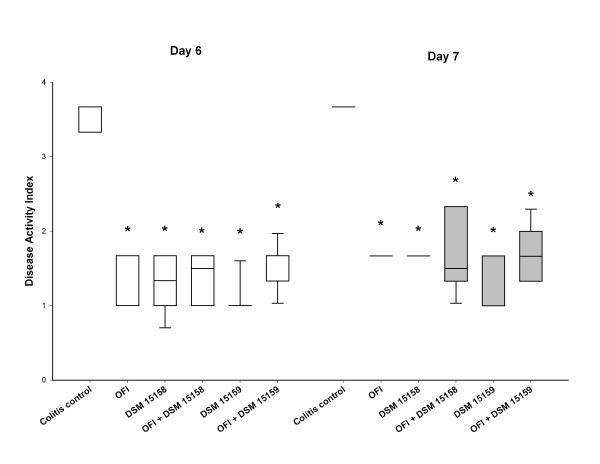
Disease activity index on day 6 and 7. Values are shown as box plots because the data were not normally distributed. The center line of each box represents the median, the top and bottom of the boxes represent the 25th and 75th percentile of the data, respectively, and the top and the bottom of the error bars represent the 10th and the 90th percentile of the data respectively. * denotes p < 0.05 compared to colitis control.