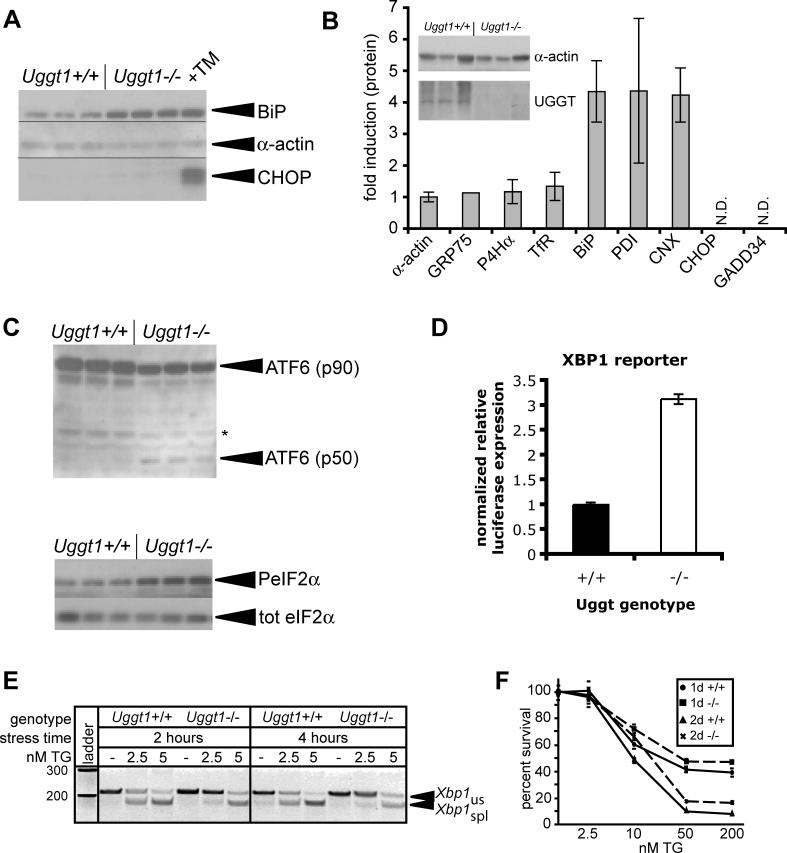
Figure 6. Uggt1 Deficiency Recapitulates an Adapted Phenotype.
(A) Lysates were prepared from three independent plates of either Uggt1−/− MEFs or wild-type counterparts, or from one plate of wild-type MEFs treated with 1-μg/ml TM overnight. BiP, α-actin, and CHOP expression were probed by immunoblot as in Figure 3B.
(B) Lysates were prepared from either Uggt1−/− MEFs or wild-type counterparts. Immunoblot for α-actin and UGGT1 (inset) from three separate plates confirmed their identities. The lysates were then probed by immunoblot for expression of α-actin, the mitochondrial chaperone GRP75, the collagen-specific ER chaperone prolyl-4-hydroxylase-α (P4Hα), the membrane-localized transferrin receptor (TfR), BiP, PDI, calnexin (CNX), CHOP, or GADD34. Expression was normalized against α-actin. Error bars represent means ± SDM from at least three measurements, except for Grp75 for which data could only be reliably quantitated from one measurement because of high background. CHOP and GADD34 were not quantitatively detected in either lysate.
(C) Lysates prepared as in (A) were analyzed for production of the cleaved form of ATF6α (top panel) or the phosphorylated form of eIF2α (bottom panel) by immunoblot. The band marked as p50 comigrates with a band induced by high TM treatment in wild-type cells (unpublished data).
(D) Wild-type and Uggt1−/− MEFs were cotransfected with an XBP1-dependent luciferase reporter and a constitutive β-galactosidase reporter. Lysates were analyzed for luciferase expression 24 h after transfection, normalized against β-galactosidase expression. Error bars represent means ± SDM from three independent plates.
(E) Wild-type and Uggt1−/− MEFs were treated with 2.5 or 5 nM TG for 2 or 4 h, and Xbp1 splicing was assessed as in Figure 2B.
(F) Wild-type (solid lines) and Uggt1−/− (dashed lines) MEFs were plated on 96-well plates and treated with increasing concentrations of TG, for either 1 or 2 d. Cell proliferation was estimated by an MTT assay, with each genotype normalized against untreated cells of that genotype. The MTT assay measures mitochondrial reduction of a tetrazolium dye, and is a measure of cell viability and proliferation.

