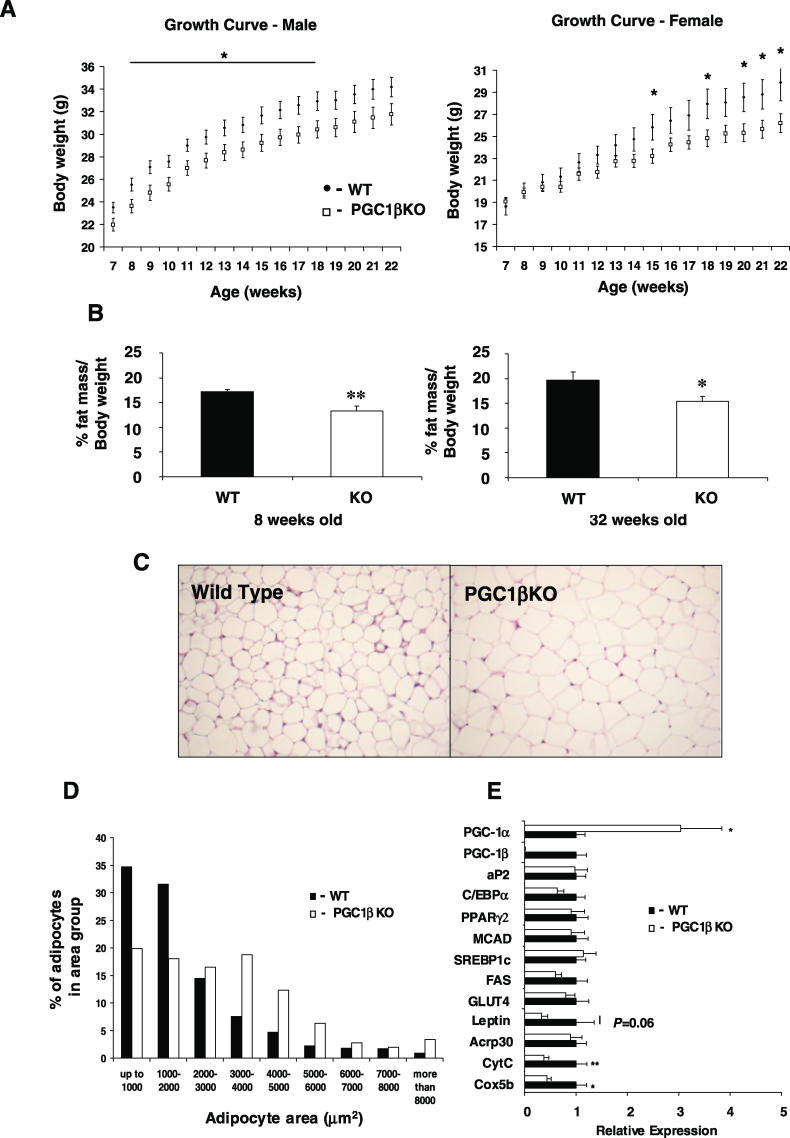
Figure 2. The PGC1βKO Mouse Has Altered Metabolism under Standard Environmental Conditions.
(A) Growth curves of male (left panel) and female (right panel) mice on normal diet. WT (solid circles) and PGC1βKO (open circles) mice, n = 18–21 mice per group.
(B) Assessment of fat content by DEXA in 8- and 32-wk-old male WT (solid bars) and PGC1βKO mice (open bars), n = 8–12 mice per group.
(C) Representative histological sections of tissues from WAT (n = 6).
(D) Size distribution of adipocytes from WT and PGC1βKO mice. Two fields from each section from epididymal adipose tissue depot (n = 4 mice per genotype) were analysed to obtain the mean cell area per animal.
(E) Epididymal WAT gene expression from 12-wk-old PGC1βKO (white bars) and WT littermates (black bars). Individual measurements are standardized using 18S, and then the average of the WT group was set to 1. n = 5–8 mice per group.

