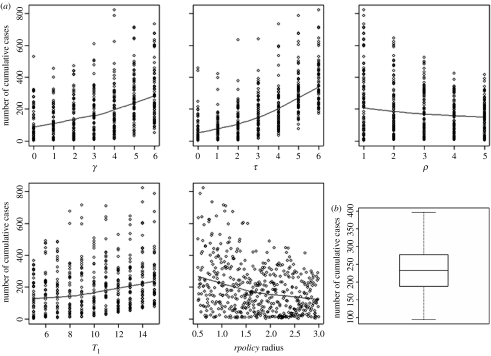
Figure 5.
Multivariate sensitivity analysis for strategy control parameters (a) impact of each of the five parameters (delay between onset of infectious period and detection within a flock: γ; delay between detection and depopulation: τ; ratio of preventive depopulated farms to reported infected farms: ρ; pre-control period, i.e. lag time between virus importation and the day the disease is confirmed in a country: T1; radius within which ring depopulation is carried out: rpolicy radius) on cumulative simulated cases. The blue lines represent non-parametric local polynomial regression fitting. (b) Impact of uncertainty of estimated spatial contact rates on the range of cumulative simulated cases.

