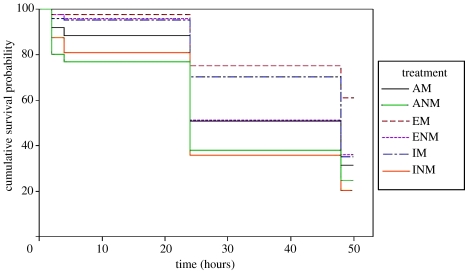
Figure 2.
Survival plot of the experimental treatments (top to bottom: average matching (AM), average non-matching (ANM), edge matching (EM), edge non-matching (ENM), inside matching (IM), inside non-matching (INM)). Curves are the probability of surviving bird predation as a function of time (in minutes), based on Kaplan–Meier estimates to account for censoring due to non-avian predation and survival to the end of the study period. Long gaps without reduced survival correspond to overnight, when targets were not checked.

