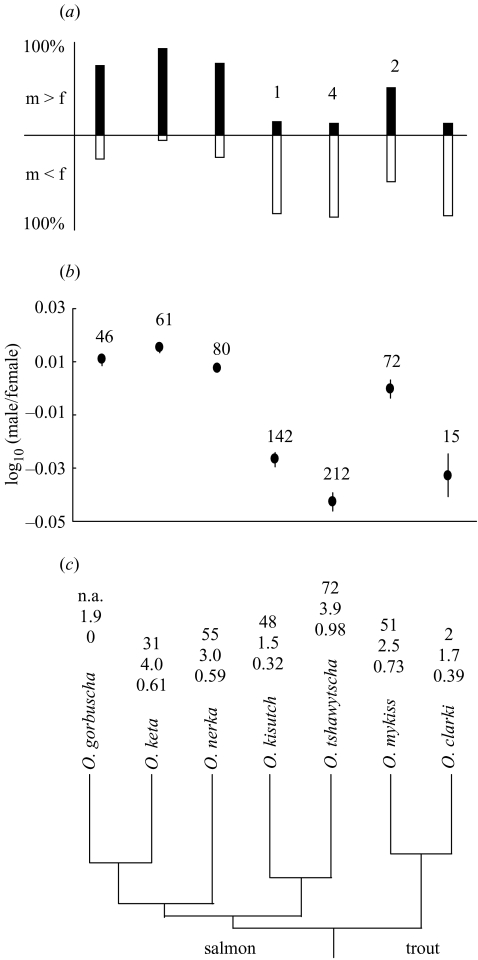
Figure 1.
(a) The proportion of populations of each species in which mean male length was larger or smaller than mean female length (the numbers above bars are the number of populations for which mean male and mean female length were equal). (b) Mean SSD of all sampled populations (± s.e.m.) The numbers above the data points are sample sizes. (c) Phylogenetic relationship of the seven Oncorhynchus species. The branch lengths are proportional to estimated divergence times (McKay et al. 1996). The numbers above species' names are, from top to bottom: the number of populations for which life-history data were available; mean marine age in years; and mean marine-age diversity (see § 2). There are no life-history data from natural populations of O. gorbuscha, which display no variation in marine age at maturation. n.a., not applicable.

