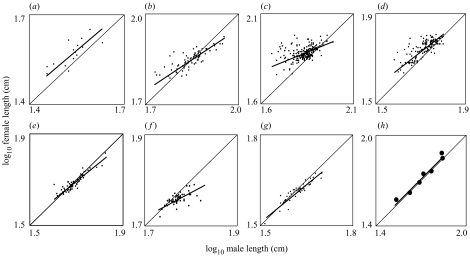
Figure 2.
The relationship between mean female length and mean male length among populations of seven species of Oncorhynchus: (a) O. clarki; (b) O. mykiss; (c) O. tshawytscha; (d) O. kisulch; (e) O. nerka; (f) O. keta; and (g) O. gorbuscha, and (h) between the species' means. In all panels the light line is the 1:1 isometric slope and the bold line is the major axis slope of female on male length. (a) Slope=0.89, 95% CI 0.48–1.62, r2=0.60, n=15; (b) slope=0.68, 95% CI 0.56–0.82, r2=0.65, n=72; (c) slope=0.42, 95% CI 0.29–0.55, r2=0.21, n=212; (d) slope=0.77, 95% CI 0.69–0.85, r2=0.61, n=142; (e) slope=0.83, 95% CI 0.74–0.94, r2=0.83, n=80; (f) slope=0.55, 95% CI 0.36–0.77, r2=0.40, n=61; (g) slope=0.83, 95% CI 0.71–0.96, r2=0.85, n=46; and (h) slope=1.02, 95% CI 0.77–1.35, r2=0.94, n=7.

