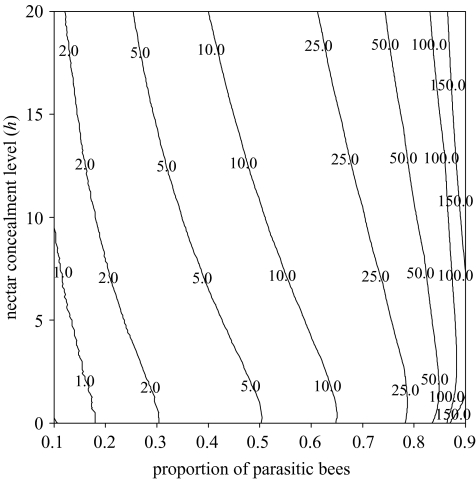
Figure 1.
Contour plot for the maximum value of δh that can invade and drive to extinction a population as a function of the proportion of X bees and the value of h (in seconds) in the existing population. The contour lines correspond, from left to right, to δh=1, 2, 5, 10, 25, 50, 100 and 150s. The total number of bees is NX+NY=5000, r=0.0001, M=6 000 000, eX=−0.1, eY=1. Handling times are τAZ=2+cZ·h, and τBZ=2+cZ·(h+δh).

