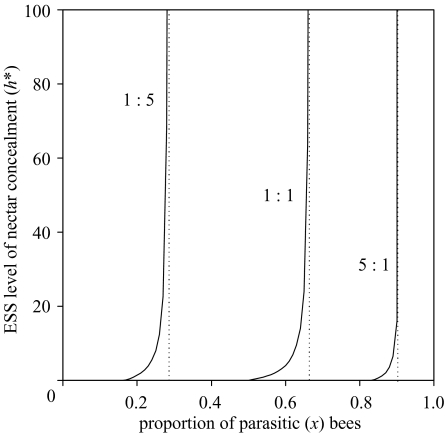
Figure 3.
Two-species condition: level of nectar concealment (value of h, in seconds) at the ESS, as a function of the proportion of X bees. The three solid lines represent the ESS for different ratios of flowers with exposed nectar in the community (indicated above the lines as ‘exposed’ : ‘concealed’). The vertical dotted lines represent the proportions of parasitic bees above which no ESS exists. The total number of bees is NX+NY=5000, MA+MB+MC=6 000 000, eX=−0.1, all other parameters as in figure 2.

