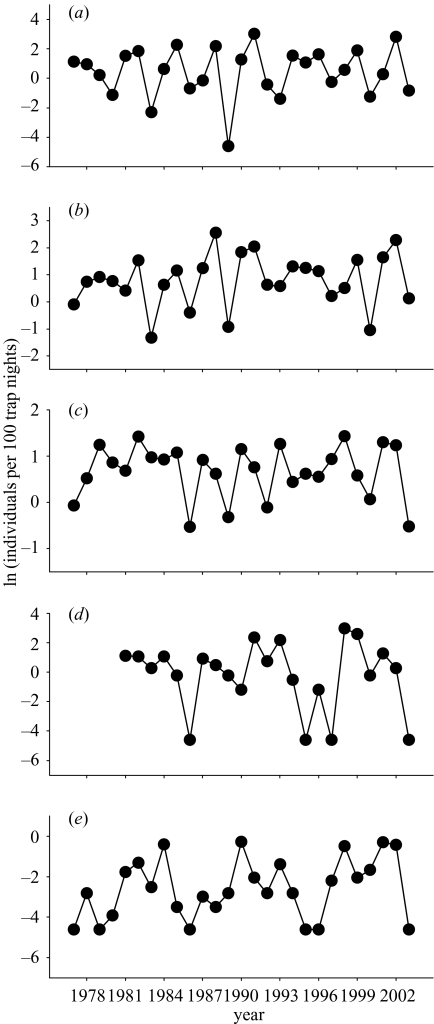
Figure 1.
Long-term population fluctuations of (a) Microtus voles, (b) bank voles, (c) common shrews, (d) water voles and (e) pooled harvest and house mice in western Finland. Symbols denote ln-transformed values of autumn trapping indices (number of individuals caught per 100 trap nights) during 1977–2003 (1981–2003 for water voles). Original trapping data for common shrews were detrended by fitting a second-order polynomial curve.

