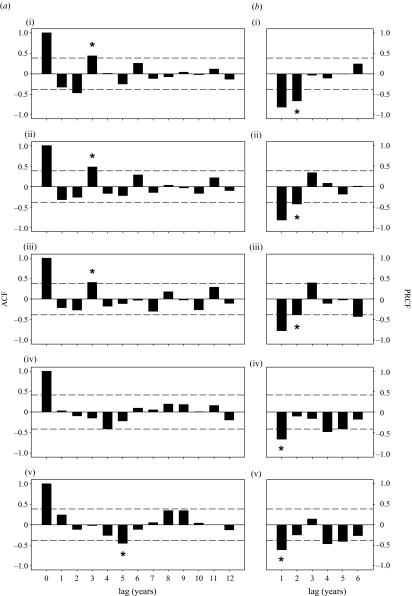
Figure 2.
(a) Autocorrelation functions (ACFs) for population time series of (i) Microtus voles, (ii) bank voles, (iii) common shrews, (iv) water voles and (v) pooled harvest and house mice in western Finland at time lags of 0–12 years. Stars above positive value bars indicate strong evidence for cyclic population fluctuations with a period length equal to the number of time lags on the x-axis. Stars below negative value bars indicate weak evidence for cyclic population fluctuations with a period length equal to approximately twice the number of time lags on the x-axis. (b) Partial rate correlation functions (PRCFs) for the same time-series at time lags of 1–6 years. Stars below the bars indicate the number of lags included as explanatory variables into autoregressive models for each species. Dashed horizontal lines in all plots indicate critical levels of significance for the correlations, obtained with Bartlett’s test.

