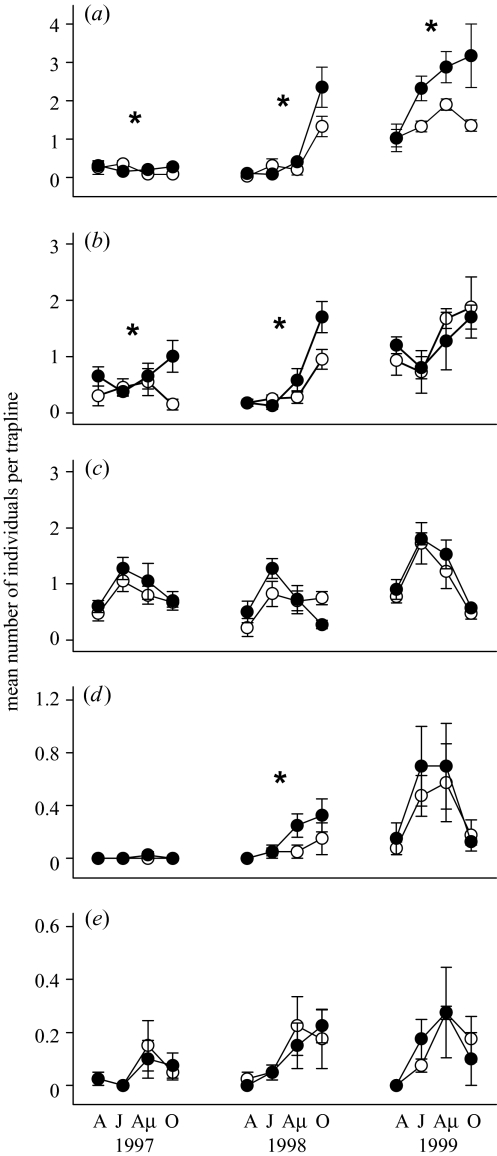
Figure 3.
The density index (measured as the mean number of individuals per trap line per area ±s.e.m., n=4) of (a) Microtus voles, (b) bank voles, (c) common shrews, (d) water voles and (e) pooled harvest and house mice from April to October (A, April; J, June; Au, August; O, October) 1997–1999 in predator reduction (filled symbols) and control areas (open symbols). Note the different scale of the y-axis in the different panels. Stars above the plots indicate significant interactions (p<0.05) between time and treatment (see table 3; statistics for Microtus are in Korpimäki et al. (2002)).

