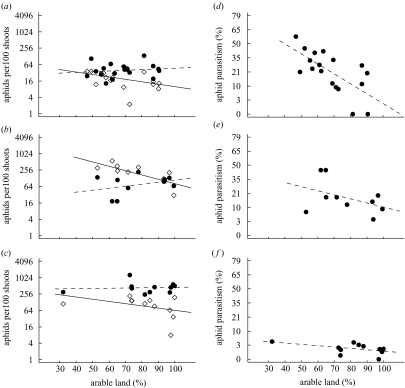
Figure 1.
Dependence of cereal aphid densities (a–c) and percentage of parasitism (d–f) on the percentage of arable land within circular landscape sectors of 1 km diameter in three consecutive years: (a,d) 2001; (b,e) 2002; (c,f) 2003. Open quadrats and solid lines: wheat flowering stage in June (after the main period of aphid colonization of the fields); filled points and dashed lines: wheat milk-ripening stage in July (after the main period of aphid reproduction in the fields). Regression lines are shown for descriptive purposes. See table 2 for statistics. Note the logarithmic scale for aphid densities.

