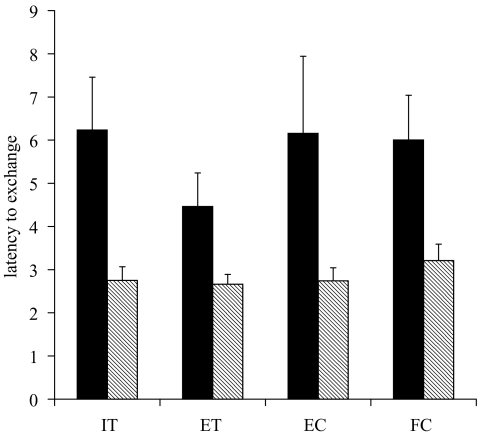
Figure 4.
Latency to exchange for high- versus low-rate refusers across the four test types. Black bars represent high-rate refusers (refuse to exchange at least 10% of the time) and hatched bars represent low-rate refusers (refuse to exchange less than 10% of the time). Abbreviations as in figure 1.

