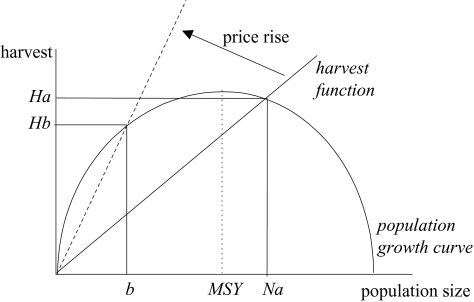
Figure 1.
The equilibrium size of an exploited biological stock and the corresponding harvest rate are determined by the point where the harvest function intersects the biological growth curve (e.g. points Na=equilibrium population size; Ha=equilibrium harvest rate). A price rise has the effect of rotating the harvest function to the left (dashed line). Whether this causes harvests to increase or decrease depends on whether the equilibrium moves from one side to the other of the maximum sustainable yield (MSY) point. In the case of the price rise shown, harvest rate is reduced (point Hb). Even though we are unable to solve explicitly for the harvest function, it is recognized that it is unlikely to be linear, as shown here. Hence, there are likely to be multiple equilibria—not all of which will be stable. For a useful discussion of these issues see May (1975).

