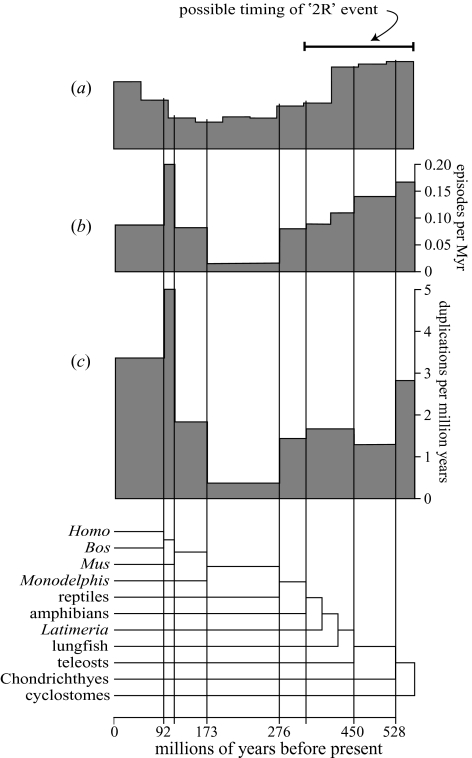
Figure 3.
The distribution of gene duplications through human evolution independent of a molecular clock. Distribution (a) is the same distribution shown in figure 1b, truncated and with the x-axis scaled for ease of comparison.The locations of human-lineage duplications on our 118 vertebrate gene families were either: (b) clustered using the duplication clustering algorithm (Page & Cotton 2002), and the distribution of duplication episodes is shown, or (c) left unclustered, but with the ambiguity in their positions taken into account. The distributions are scaled so that branch lengths in the species tree reflected dates of cladogenesis events from Kumar & Hedges (1998). Dates were interpolated for events not included in the Kumar and Hedges study. The y-axis scale for (a) is as in figure 1b; for (b) shows the number of duplication episodes per million years; and for (c) shows the number of individual duplications per million years.

